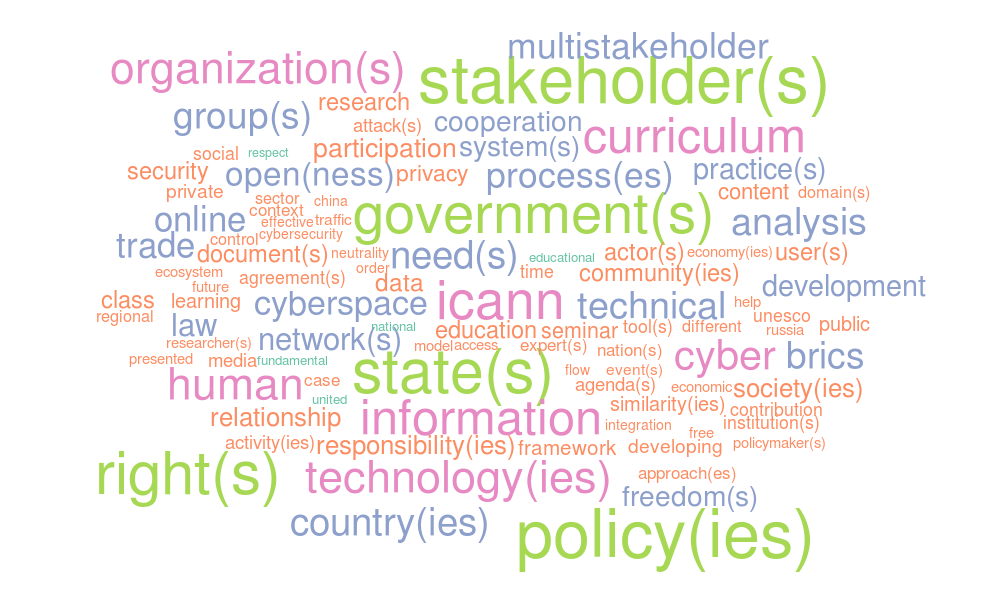
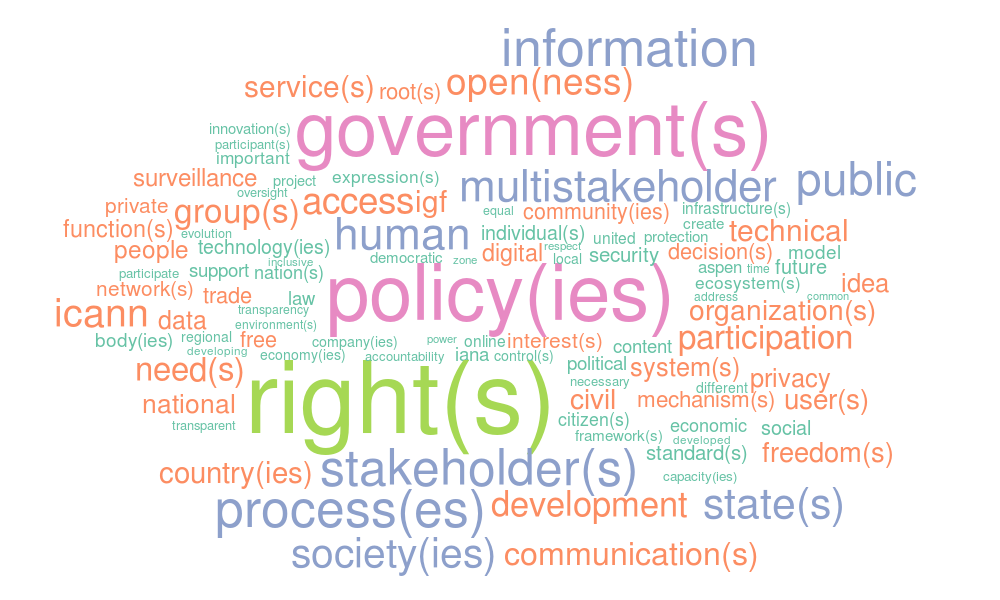
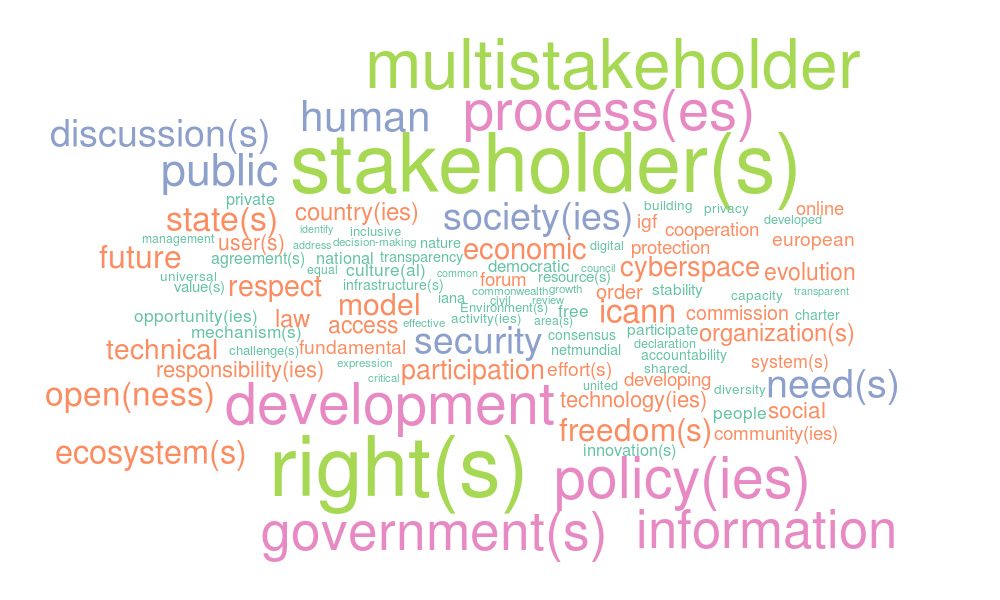
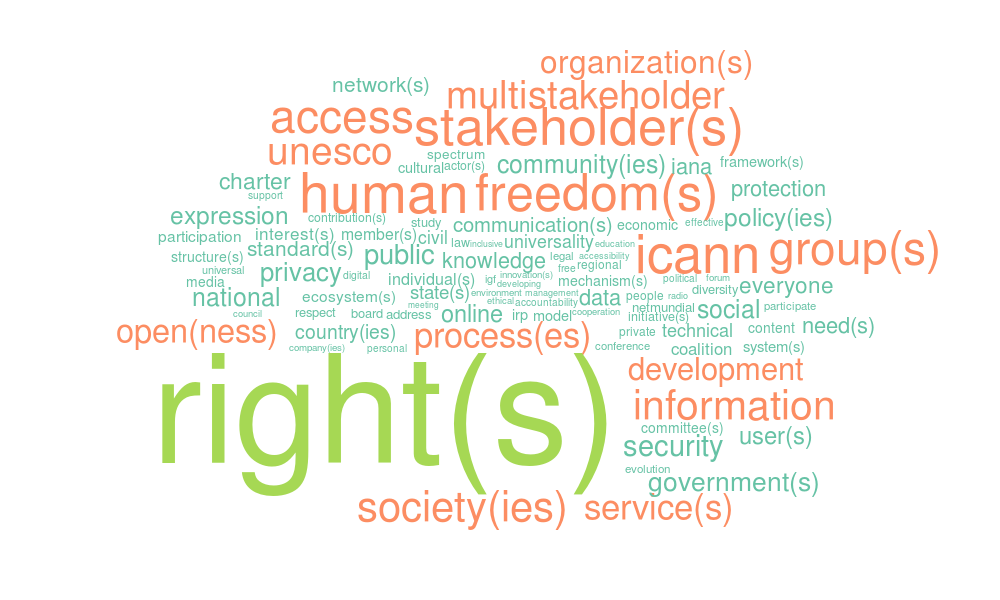
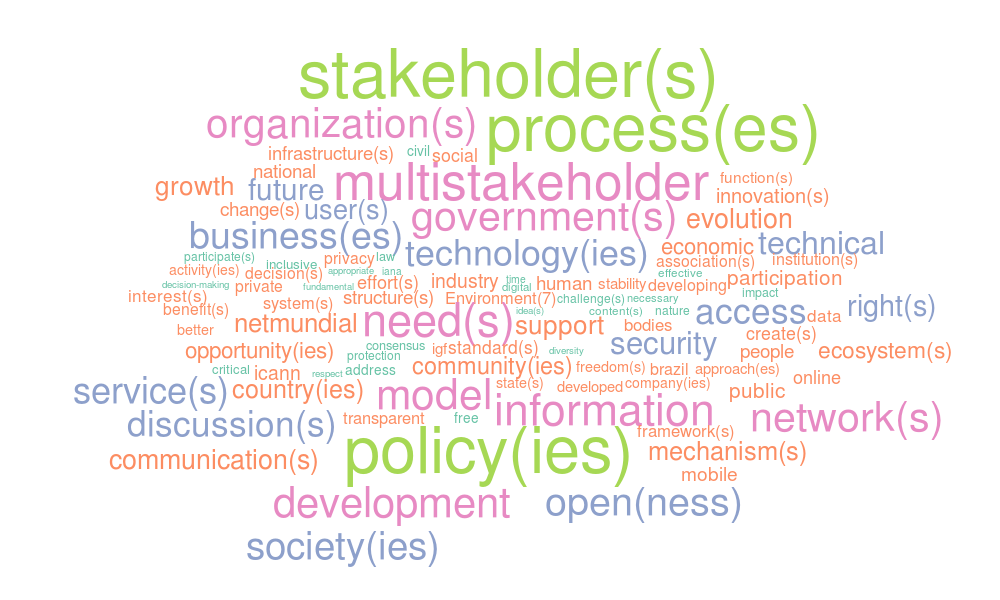
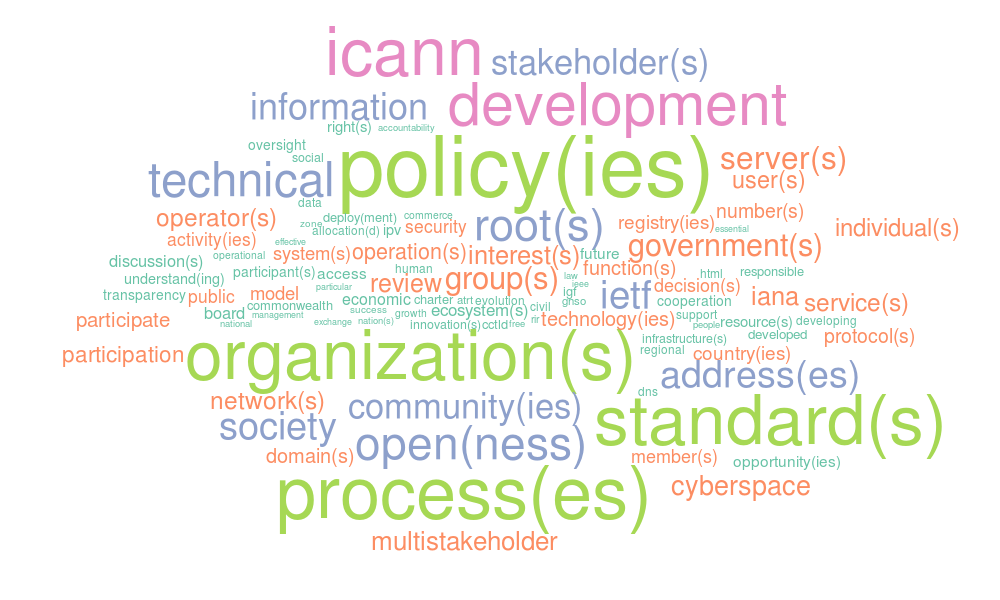
These word clouds show the hundred most frequently appearing words in the aggregated contribution text of each type of organisations.
The size of the words in these diagrams refer to their frequency of appearance. A larger size refers to higher frequency of appearance. The colour of the words have been differentiated to group the words according to their freuqency of appearance. The color hierarchy is as follows: Green, Pink, Blue, Red.
While creating these word clouds, certain common English words (like, 'the' and 'and') and obvious words for the contributions (like, 'internet' and 'governance') have been ommitted. The full list of ommitted words have been documented in the R code used to generate the diagrams.
Analysing Contributions to NETmundial 2014
This set of analysis of the contributions submitted to NETmundial 2014 is part of the effort by the Centre for Internet and Society, Bangalore, India, to enable productive discussions of the critical internet governance issues at the meeting and elsewhere.
The Centre for Internet and Society, Bangalore, India, is a non-profit research organization that works on policy issues relating to freedom of expression, privacy, accessibility for persons with disabilities, access to knowledge and IPR reform, and openness, and engages in academic research on digital natives and digital humanities.
The visualisations are done by Sumandro Chattapadhyay, based on data compilation and analysis by Jyoti Panday, and with data entry suport from Chandrasekhar.
